


'%3e%3cpath%20d='M4.5%2026C5.00617%2026%205.4077%2025.7595%205.68925%2025.4945C5.96604%2025.234%206.18488%2024.899%206.36251%2024.5534C6.71916%2023.8595%207.0109%2022.9208%207.24494%2021.8442C7.71658%2019.6746%208%2016.725%208%2013.5C8%2010.275%207.71658%207.32539%207.24494%205.15584C7.0109%204.07923%206.71916%203.14051%206.36251%202.4466C6.18488%202.10099%205.96604%201.76603%205.68925%201.50548C5.4077%201.24047%205.00617%201%204.5%201C3.99383%201%203.5923%201.24047%203.31075%201.50548C3.03396%201.76603%202.81512%202.10099%202.63749%202.4466C2.28084%203.14051%201.9891%204.07923%201.75506%205.15584C1.28342%207.32539%201%2010.275%201%2013.5C1%2016.725%201.28342%2019.6746%201.75506%2021.8442C1.9891%2022.9208%202.28084%2023.8595%202.63749%2024.5534C2.81512%2024.899%203.03396%2025.234%203.31075%2025.4945C3.5923%2025.7595%203.99383%2026%204.5%2026Z'%20stroke='%233D534A'%20stroke-width='2'/%3e%3cpath%20d='M40.5%2026C40.9917%2026%2041.3862%2025.7712%2041.6669%2025.5131C41.9426%2025.2595%2042.1624%2024.9319%2042.3422%2024.5893C42.7028%2023.9023%2043.0022%2022.9608%2043.2449%2021.8442C43.7335%2019.5969%2044%2016.5965%2044%2013.5C44%2010.4035%2043.7335%207.40306%2043.2449%205.15584C43.0022%204.03922%2042.7028%203.09775%2042.3422%202.41067C42.1624%202.06812%2041.9426%201.74047%2041.6669%201.4869C41.3862%201.22879%2040.9917%201%2040.5%201'%20stroke='%233D534A'%20stroke-width='2'%20stroke-linecap='round'/%3e%3cpath%20d='M41%201C41%201%2033.125%204%2023%204C12.875%204%205%201%205%201'%20stroke='%233D534A'%20stroke-width='2'%20stroke-linecap='round'/%3e%3cpath%20d='M5%2026C5%2026%208.70632%2024.4712%2016.5714%2024M41%2026C41%2026%2037.2937%2024.4712%2029.4286%2024'%20stroke='%233D534A'%20stroke-width='2'%20stroke-linecap='round'/%3e%3cpath%20d='M18%205V15M27%205V15'%20stroke='%233D534A'%20stroke-width='2'%20stroke-linecap='round'/%3e%3cpath%20d='M23%2026.1111C26.4102%2026.1111%2029%2023.0744%2029%2019.5556C29%2016.0367%2026.4102%2013%2023%2013C19.5898%2013%2017%2016.0367%2017%2019.5556C17%2023.0744%2019.5898%2026.1111%2023%2026.1111Z'%20stroke='%233D534A'%20stroke-width='2'/%3e%3cpath%20d='M16.0417%2024L7%2031.8L12.1667%2033.1L16.0417%2037L22.5%2026.6L28.9583%2037L32.8333%2033.1L38%2031.8L28.9583%2024'%20stroke='%233D534A'%20stroke-width='2'%20stroke-linecap='round'%20stroke-linejoin='round'/%3e%3c/g%3e%3cdefs%3e%3cclipPath%20id='clip0_1002_3042'%3e%3crect%20width='45'%20height='38'%20fill='white'/%3e%3c/clipPath%3e%3c/defs%3e%3c/svg%3e)


Methods
To identify whether BIL funding is reaching communities that the state and federal governments have prioritized as historically overburdened and underserved, we analyze BIL award data in relation to two environmental justice screening tools. We use spatial analysis techniques to examine a subset of California awards. Below, we summarize our analytical approach; more details are available in the Technical Appendix associated with this project, and all R scripts used for analysis are available for download via our GitHub repository.
Overall BIL Award Data
We analyze publicly available BIL prime award grant listings from the U.S. Department of the Treasury, Bureau of the Fiscal Service for federal fiscal year (FFY) 2022 and 2023. BIL award data were downloaded from USASpending.gov on March 31, 2024, which is the official source of government spending data. Our analysis focuses on awards with a place of performance in California, for which we assess the total obligated amount. This dollar amount includes BIL funding as well as other funding sources associated with the prime award.
We analyze $2.1 billion invested in non-transportation BIL awards (n = 401 awards), we focus on the $779.28 M across 241 awards with a local place of performance. We exclude local awards that could not be mapped (n = 12 awards) and non-transportation grants with a statewide place of performance (n = 148 awards), because we cannot adequately discern the beneficiaries of statewide awards with existing publicly available datasets.
Spatial Analysis of BIL Awards for the Dashboard
We analyze where funding is flowing in relation to two environmental justice screening tools: the federal Climate and Economic Justice Screening Tool version 1.0 and the California-specific SB 535 Disadvantaged Communities list, which is partially derived from the tool CalEnviroScreen.
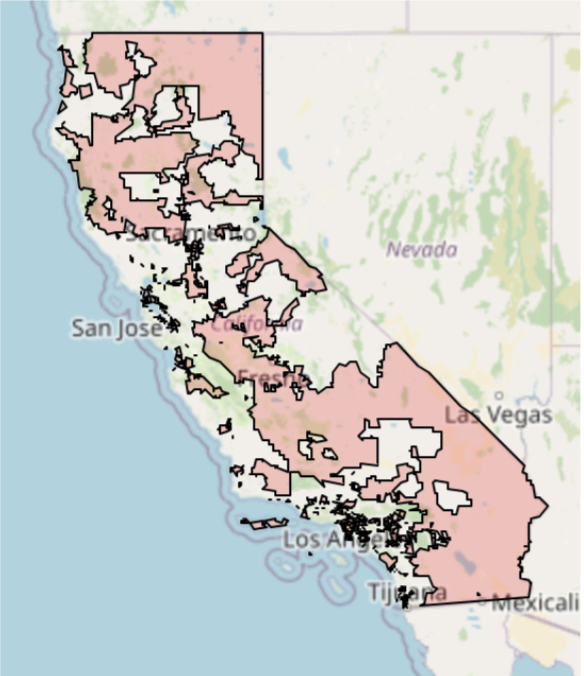
The Climate and Economic Justice Screening Tool (CEJST) was built by the White House Council on Environmental Quality to support federal agencies in identifying disadvantaged communities (DACs) in service of the Justice40 Initiative. The CEJST tool defines communities as disadvantaged if they meet at least one of three criteria, including land within the boundaries of Federally Recognized Tribes (learn more).
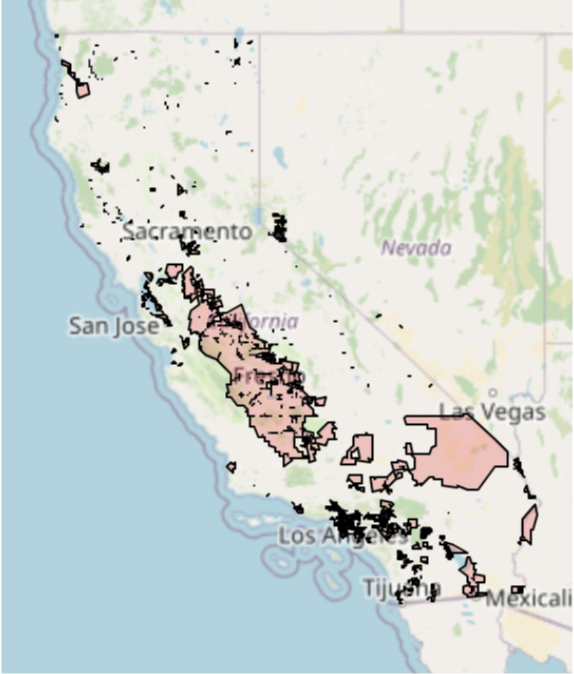
California Senate Bill 535 (SB 535) requires that a certain portion of the state’s California Climate Investments focus investments in disadvantaged communities. CalEPA designated areas as disadvantaged communities that meet at least one four criteria, including lands under control of Federally Recognized Tribes (learn more).
To analyze which communities have obligated funding from BIL awards, we focus on the primary place of performance designated for each award (i.e., statewide, county-wide, city-wide, or single zip code), as well as the recipient type. We used 2020 decennial census data to assign each award the spatial geometry associated with the primary place of performance. Specifically, we assess 241 awards whose listed primary place of performance matched a county, city, zip code, or federally recognized American Indian areas. We then intersect the award geometries with the spatial geometries identified as Disadvantaged Communities (DACs) by CEJST and SB 535, and we calculate the percentage of each award’s total spatial area that overlaps with each DAC measure. We assign each award to one of six categories based on the spatial intersection, as well as the recipient type: 0% intersection, 0.01-25%, 26-50%, 51-75%, 76-99%, and 100% or Tribal Recipient. Awards that included a Tribal Recipient in the award recipient business type(s) were conservatively categorized as flowing toward DACs (i.e., the “100% or Tribal Recipient” category), following the convention in CEJST.
Limitations
Below, we highlight several limitations of the approach and its reliance on existing publicly available data. Addressing datasets limitations would open possibilities for further Justice40 analysis.
- Spending data in USAspending.gov may be missing due to agency non-reporting and non-compliance with the 2014 Digital Accountability and Transparency Act.
- The place of performance field used to map awards may contain inaccuracies that could lead to over- or undercounting awards to prioritized communities.
- Environmental justice screening tools represent but one way of prioritizing communities, with inherent limitations to both the approach and the analysis.
- The sector assignments in this analysis are an approximation of the federal categories under BIL, because BIL Guidebook program titles do not exactly match USASpending information on program activities funding the award.
- Because there is not yet a federal definition of “benefits” for the Justice40 program and because accountability toward Justice40 goals remains inconsistent across federal agencies, this analysis focuses on where BIL funding flows, and not the extent to which funds benefit those communities.